


Any engineer most likely has come across the famous piping and instrumentation diagram. This specialized chart is critical for the engineering system’s design, which is helpful for problem identification and solving and ensuring that a facility keeps running smoothly. As such, nearly every facility (e.g., any plant, manufacturing area, laboratory, or other commercial factory) should have piping and instrumentation drawings.
Piping and Instrumentation Diagram (P&ID) Meaning
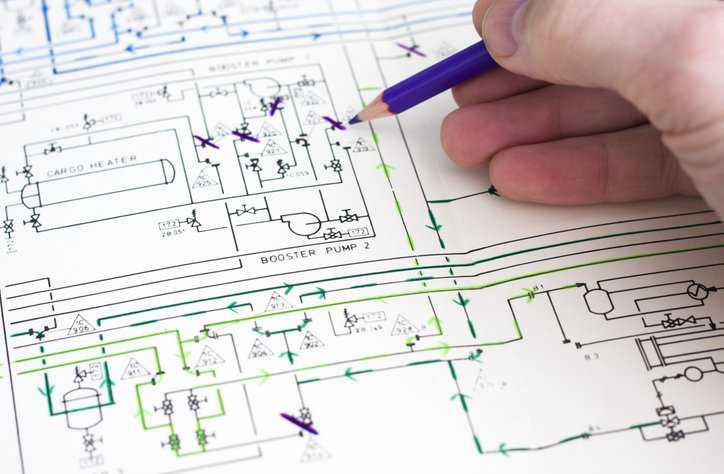
Piping and instrumentation diagrams (P&IDs) are articulate drawings of a processing plan with various symbols and abbreviations that entail the piping and process equipment with its instrumentation and control machinery. In other words, P&IDs are schematics or diagrams that lay out the basics of a piping design for what will eventually become the complete pipework system. They represent interconnecting pipework through straight lines, highlighting valves, connectors, labels, fasteners, and other equipment through clear symbols. P&IDs simplify and expedite complicated information on mechanisms or piping details in a simplified diagram.
Piping and Instrumentation Diagram (P&ID) Symbols
P&ID symbols are representative of the functional relationship between piping, instrumentation, and system equipment units. The symbols are standard shapes that are categorized according to their functions and industrial uses. The main categories of P&ID symbols are as follows:
- P&ID Valve Symbols—valves are used for controlling the flow of a fluid by opening, closing, or partially obstructing passageways in a piping system. This category includes rotameters, orifices, and other types of valves.
- P&ID Pump Symbols— pumps can be used for suction, compression, moving fluid, and pressure control. This section is comprised of both pumps and fans.
- P&ID Piping Symbols— piping equipment transports fluid substances. There are multiple types of pipes that can be made from various materials like plastic or metal. The piping group is made up of simple, multi-line, separators, connectors, end caps, flanges, reducers, and coupling.
- P&ID Instrumentation Symbols— an instrument measures (and sometimes controls) quantities such as flow, temperature, angle, or pressure. The instruments group houses indicators, transmitters, recordings, controllers, and elements.
- P&ID Vessels Symbols— vessels are containers used to store fluid. The vessels category includes tanks, cylinders, columns, bags, and other vessels.
- P&ID Heat Exchangers Symbols— heat exchangers efficiently transfer heat from different areas or mediums. This category includes boilers, condensers, and other heat exchangers.
- P&ID Compressors Symbols— compressors and blowers move air or gas through an operational process. Compressors operate at a high pressure-to-volume ratio, while blowers operate at a low-pressure ratio.
- P&ID Equipment Symbols— equipment is comprised of miscellaneous P&ID units that don’t fit into the other categories. This group includes hardware like compressors, conveyors, motors, turbines, vacuums, and other mechanical devices.
There is a wide variety of symbols, depending on industry and manufacturer. Luckily, standards like ANSI/ISA 5.1 and ISO 14617-6 serve as a conceptualizing aid, library, and teaching device for understanding the specific means of communication and technical applications for P&ID graphical symbols.
You can learn more about ANSI/ISA 5.1 in our blog post: ANSI/ISA 5.1-2024: Instrumentation Symbols and Identification.
What Should a Piping and Instrumentation (P&ID) Drawing Include?
P&IDs can be manually drawn or in a digital format. Both formats commonly contain information on vents, drains, and sampling lines as well as flow directions, control I/O (input/output), and Interconnection References. Here is what a P&ID drawings should include:
- Mechanical equipment with names and numbers
- General and mandatory safety requirements
- All valves and their identifications
- Process piping, sizes, and identification
- Details on the control and shutdown of equipment
- Miscellaneous components like vents, drains, special fittings, sampling lines, reducers, increasers, swagers, and permanent start-up and flush lines
- Flow directions
- Seismic category and annunciation inputs
- Computer control system input
- Interfaces for class changes
- Interconnections reference, control inputs and outputs, and interlock
- Quality level
- Vendor and contractor interfaces
- Identification of components and subsystems delivered by others
- Intended (or estimated) physical sequence of the equipment and its rating or capability

How To Read P&ID
Understanding how to read a P&ID effectively requires familiarity with standard instrument symbols and standard identification letter codes. In other words, each instrument involved in the process appears on the P&ID and is represented by a symbol and a code.
- The symbols represent the equipment in the process like actuators, valves, and controllers.
- The standard identification letter codes help with grouping all equipment into a 3 letter or less abbreviation. Sometimes you will use more letters, but 2-3 letters cover the vast majority of use cases. For example, FCV refers to flow control valve, FIT refers to flow indicating transmitter, and LAL refers level alarm low.
As you can note, the first letter of the code represents the parameters that are being controlled or monitors, measured, such as Analysis (A), Flow (F), Pressure (P) Temperature (T), etc. The succeeding letters defines the type of control device being used, for example, Control (C), Indicator (I), Transmitter (T), Valve (V) etc. On a P&ID drawing, these abbreviated indicators are typically shown inside of a circle, diamond, square, or some combination of these shapes. Sometimes, these abbreviations are groups with numbers, which refer to the logical numerator. For example, there may be a system with 4 temperature transmitters (TT), so it makes sense to identify these as TT01, TT02, TT03, and TT04.
P&ID drawing symbols, circles, and lines represent instruments and show how they are connected to the rest of the system. The presence or absence of a line in the circle determines the location of the physical device. If there is no line, the instrument is located in the field near the process and operator; if there is a solid line, the instrument is located in a control room (accessible to the operator); and if there is a dotted line, the instrument is not directly accessible. Moreover, the piping or connection lines on the P&ID give information about the associations between instruments, meaning how the instruments connect to each other and the type of signal being transmitted. For example, a solid line indicates the interconnection is via pipework, while a dotted line indicates an electrical connection.
What Industries Use P&IDs?
ANSI/ISA 5.1 and ISO 14617-6 help various users—namely field tech, designers, engineers, and operators—who need to identify and graphically depict measurement and control equipment and systems in P&IDs. The diagrams can be used be in the chemical, petroleum, power generation, metal refining, pulp and paper, and numerous other continuous, batch, discrete-part processing, and material-handling industries.
These industries and others (like oil refineries or cement plants) require the use of control system schematics, functional diagrams, and electrical schematics—which are mapped out in P&IDs. Hence, P&IDs describe the relationship to processing equipment and the functionality of measurement and control equipment, depicting the complex chemical and mechanical steps.